Higher Education Institutions (HEIs) are said to be “as different as chalk and cheese”, and indeed, by looking at ETER data, such differences are highly apparent. In terms of students, the largest HEI in ETER, the Anadolu University in Turkey, exceeded 3 million students in 2020 (taught primarily online), while more than 350 HEIs in ETER enrolled at the same time fewer than 500 students each. In terms of academic personnel, six HEIs in ETER employed more than 6,000 staff (in Full-Time Equivalents (FTEs)), while more than 500 HEIs in ETER had fewer than 100 FTEs of academic personnel.
Beyond size differences, HEIs are also vastly diverse in terms of their engagement in research vs. education and the subject domains, with some HEIs providing research and/or education in most domains and many others focused on specific areas such as Technical Universities, Teacher Training Institutions and Schools of Arts.
Unfortunately, comparisons such as those provided by international rankings tend to neglect these underlying differences and claim to compare HEIs independently of their characteristics using universal measures of excellence derived from bibliometrics and reputational surveys. This needs to be more accurate to be useful for institutional managers since, for most HEIs, competing with top-ranked universities worldwide is not feasible simply because of differences in the level of resources.
The idea of customised comparisons was pioneered by the U-Multirank project, which will become, together with ETER, one of the backbones of the future European Higher Education Sector Observatory.
ETER now provides a simple tool to identify a group of similar HEIs based on a few simple indicators, namely institutional control (public vs. private), PhD status (yes/no), size (based on academic personnel), education intensity (students divided by academic personnel), master orientation, PhD intensity (PhD students divided by undergraduate students), subject concentration and specialisation in individual subjects (for full details refer to the Methodological Handbook Section 7.3.14). The classification indicators can be selected in the variables tab in the ETER database under the tab indicators.
The figures illustrate the usage of this tool. In example 1, we select the largest public and PhD-awarding HEIs in ETER with the highest level of research intensity and specialisation in natural and technical sciences. The tool identifies eleven very large technical and scientific universities in Europe.
Example 1: The largest and most research oriented technical HEIs in ETER
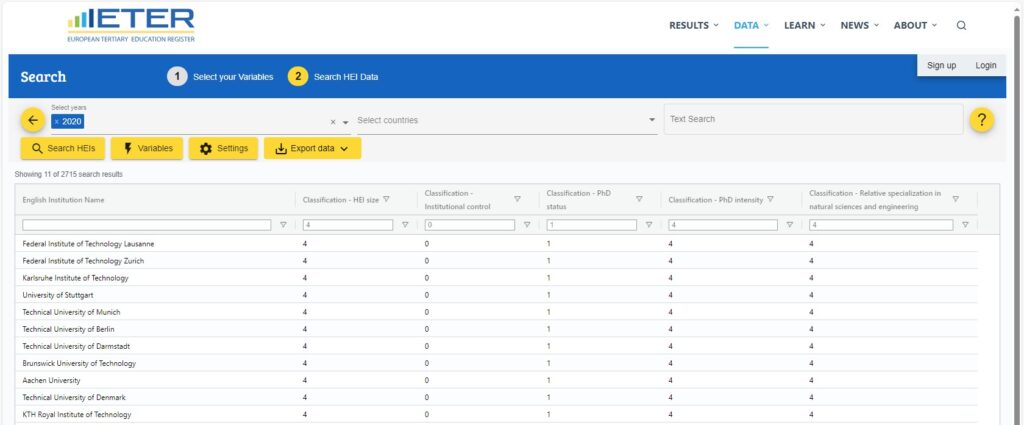
Note: HEI size 4 = more or equal 1,500 FTEs; Institutional control 0 = public; PhD status 1 = yes; PhD intensity 4 = more or equal to 0.08; Relative specialisation in natural sciences and engineering 4 = more or equal 0.60
In example 2, we instead focus on the largest public non-PhD awarding HEIs in Europe: these are all very large and generalist Universities of Applied Sciences with several tens of thousands of students.
Example
2. The largest non-PhD awarding HEIs in Europe
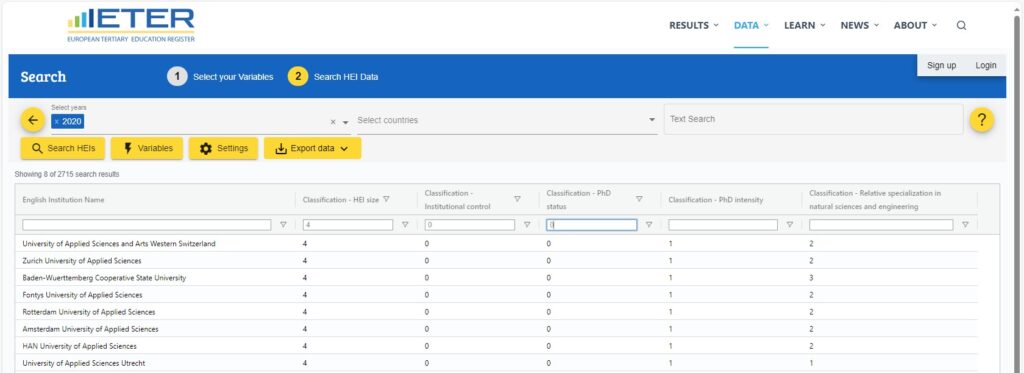
HEI size 4 = more or equal 1,500 FTEs; Institutional control 0 = public; PhD status 0 = no
These examples demonstrate how the ETER database, thanks to its broad coverage of HEIs in Europe, can be mobilised to identify groups of reasonably similar institutions for more meaningful comparisons. The approach will be further refined within the framework of the European Higher Education Sector Observatory.